If you’re looking for a beginner CTF style challenge for reverse engineering, look no further than the Linux Bomb provided by Open Security Training. Don’t let the Linux part put you off! Its an excellent test of your understanding of some of the key concepts of assembly. You can get the binary and the training material at the following:
http://opensecuritytraining.info/IntroX86.html
The tools I used for this are as follows:
- REMnux Virtual Machine – https://remnux.org/
- objdump (terminal disassemble, included in REMnux)
- gdb dubugger (terminal debugger, included in REMnunx)
- scite text editor (also included in REMnux)
This is not the only tools you can use and its probably not the best either, but my Ubuntu machine needed some extras installed to do this so I just switched to my REMnux for ease. If you need a guide on how to setup a full environment for analysis check out:
https://malwarephobia.wordpress.com/
The idea of this challenge is to work your way through 6 phases of the binary. Each phase expects an input from you and its your job to reverse engineer each phase to find out what inputs its expecting. If you get it wrong…BOOM!
First, its worth creating a cmd list for gdb. This will make gdb display some key areas of the assembly in the terminal each time you run a cmd which really is needed for this. The start command will start the debgger and set a breakpoint at the start. Place the following cmds in a text file somewhere convenient:
- display/10i $eip
- display/x $eax
- display/x $ebx
- display/x $ecx
- display/x $edx
- display/x $edi
- display/x $esi
- display/x $ebp
- display/32xw $esp
- start
Next, you can use objdump from the terminal to disassemble the binary to investigate in depth. If you pipe it into less you can scroll through the code at will. I decided to output it to a file so I could edit the text as I went using scite, to make the analysis a little easier. The commands are as follows:
objdump -M intel -d bomb > bombDis
scite bombDis &
Run gdb from the terminal giving the bomb as the input file and use -x to feed it the cmd file:
gdb bomb -x gdbcmds
Now you should have a terminal open with the debugger ready to go and scite with the disassembled code for reference.
If you look carefully, you’ll see that theres quite a few differences between the disassembled code and the debugger. This is due to the debugger using AT&T format whereas the disassembled code is in Intel format. This way you will get exposure to both formats.

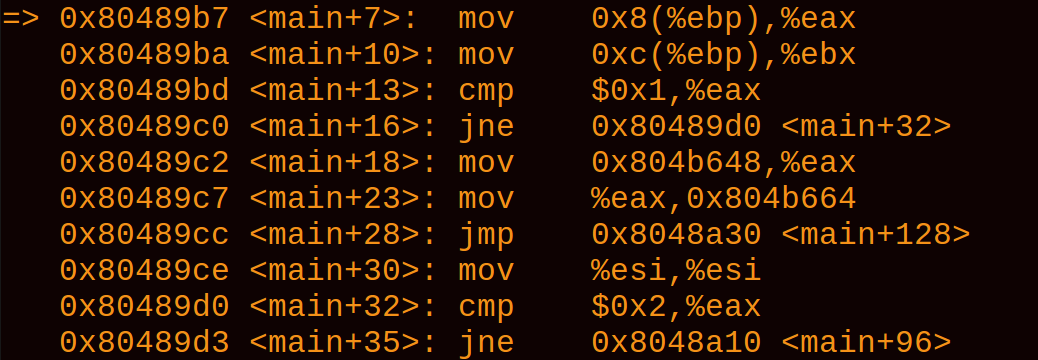
The main things to look out for are the following:
- Registers are denoted by %
- Literals are denoted by $
- Instructions are backwards (or maybe its not backwards :/) eg. cmp eax, 0x1 = $0x1, %eax
- Pointers to memory are denoted by () eg. [ebp +8] = 0x8(%ebp) (this gets even more confusing with displacement so check disassembler)
If you would prefer to have both formats matching, you can either switch objdump to AT&T format by omitting the -M intel option or switch gdb with the following cmd from within gdb:
set disassembly-flavor intel
gdb is an extremely powerful debugger once you get used to it. Its obviously not going to provide the great visuals most are used to these days but this can be an advantage as you really need to know your stuff to get what you want. Some of the commands you will need are as follows:
- r = start debugging, can be given inputs (also restarts debugging)
- c = continue execution, eg. after a breakpoint
- b = set breakpoint (takes either names eg. b main or addresses, eg. b 0x100001or b *ffff0007 for memory)
- i b = display all breakpoints
- d <n> = delete breakpoint by number, eg. d 15
- si = step into
- ni = step over
- x/s <n> = display string at address, eg. x/s %eax or x/s 0x10000001
- help for anything else (theres also plenty of cheat sheets online)
With that, everything should be good to go. You now have a setup which can be replicated for any other ELF files you may come across in the future.
Give it a crack and look out for the next part which will start walking through how to tackle the phases.
Edit: Part 2 now available which covers the first 3 phases of this challenge.
https://mcb101.blog/2019/02/16/linux-bomb-walkthrough-part2-phases-1-3/
Follow me on twitter to get updates on new posts and other related info abiut the field. https://twitter.com/mcb0x2Eexe

You should probably mention that GDB is using the AT&T format while objdump is using the Intel format (which is odd since I thought it uses AT&T by default). You can force one format or the other in both programs. I prefer Intel as it’s a bit easier to read (for me anyway):
$ objdump -M intel -d binary
(gdb) set disassembly-flavor intel
LikeLike
Thanks, I’ll take a look at that. I did have that in there originally but it may have been cut when I edited it.
LikeLike